What beaconing is
Beaconing is the regular check-in a piece of attacker software makes to the server that controls it. Once you know its shape, you can look for it in data you probably already collect: connections from one machine to one destination, at steady intervals, carrying small amounts of data, started by a process that has no business talking to the internet.
Most remote-access tools used by attackers do not keep a connection open all the time. That would be easy to spot and fragile. Instead the implant wakes up, connects to its command-and-control server, asks “anything for me?”, receives an instruction or nothing, and goes back to sleep. In MITRE ATT&CK this falls under Command and Control, most often Application Layer Protocol: Web Protocols (T1071.001), because HTTP and HTTPS blend in with normal traffic.
The check-in is the attacker’s weak point. They need it to keep control, and it has to happen again and again. Each repeat is another chance for you to notice.
The shape of a beacon: intervals, jitter and size
Three properties give beaconing away. The first is regularity. If you take all connections from one host to one destination and measure the gaps between them, a beacon produces gaps that cluster tightly around one value: 60 seconds, five minutes, an hour. Human browsing produces gaps all over the place.
The second is jitter. Attackers know regularity is a giveaway, so many tools add random variation to the sleep time. A five-minute sleep with 20% jitter, as an illustrative setting, produces gaps anywhere between four and six minutes. That spreads the pattern out, but it still clusters far more tightly than human activity. A simple measure is the spread of the gaps divided by their average: the lower it is, the more machine-like the traffic.
The third is size. Check-ins with nothing to do are small and similar: a request of a few hundred bytes, a response of much the same size each time. When the operator sends a task, you see an occasional larger response, followed by a larger request carrying the output. Steady small exchanges broken by rare bigger ones is a classic pattern.
- Many connections from one host to one destination over hours or days
- Gaps between connections that cluster around one value, even with jitter
- Small, similar request and response sizes, with occasional larger ones
- A destination that is rare across your estate: one or two machines talk to it, not hundreds
- Activity that carries on through the night and at weekends, when nobody is at the keyboard
The network and process data you need
Network records give you timing and size. Firewall logs, web proxy logs, DNS logs and flow records all help. In Zeek’s conn.log, each connection has a timestamp, the source and destination addresses (id.orig_h and id.resp_h), a duration and byte counts in each direction (orig_bytes and resp_bytes). In Elastic Common Schema you are looking at source.ip, destination.ip, destination.port, destination.domain, network.bytes and, for proxies, url.full and user_agent.original.
Network records alone cannot tell you which program made the connection. For that you need endpoint data: process events that carry network activity, such as Elastic Defend network events with process.name, process.executable and process.entity_id, or Sysmon Event ID 3 on Windows. With both, you can say not only that a host called out every five minutes, but that /tmp/.cache/agent, started by a shell under a web server account, did it.
Collect over a long enough window. A beacon that checks in hourly produces only a few dozen connections a day, and a pattern needs many points before it stands out from noise. Analysing a day or more of connections per host and destination pair works far better than looking at the last fifteen minutes, and it also catches implants set to sleep for long periods.
DNS deserves its own look. Some implants beacon over DNS itself, and almost all of them look up their server’s name. A host that resolves the same rare domain at a steady interval is worth checking even when the connection data is thin.
What else beacons: updaters, agents and monitoring
Plenty of legitimate software behaves exactly like this. Operating system and browser updaters check in on a schedule. Endpoint security agents, backup agents, configuration management clients and monitoring agents report home every few minutes. Chat and email clients poll. Telemetry from almost any modern application calls out regularly. A beacon hunt that ignores this will drown you.
The way through is to judge the pairing of process and destination rather than the traffic alone. A signed agent in its expected install path, talking to its vendor’s known service, on every machine where it is installed, is normal. The same timing from a binary in /tmp or /dev/shm, from a process whose parent is a web server or an interactive shell, to a destination that only one machine in your estate has ever contacted, is not.
Build an allow list of known-good process and destination pairs, written as narrowly as you can, and review it. Then rank what is left by rarity: the fewer machines talk to a destination, the more interesting it is. Threat-intel lookups of the destination (for example in VirusTotal, AlienVault OTX or AbuseIPDB) add context, but a clean result is not proof of innocence. Attackers often use fresh infrastructure that no list knows about yet.
- Is the process signed, and in its expected install path?
- Is the destination the vendor’s known service, and do many machines talk to it?
- What started the process, and when did it first appear on this machine?
- Does the timing match the product’s documented check-in interval?
An example from our lab
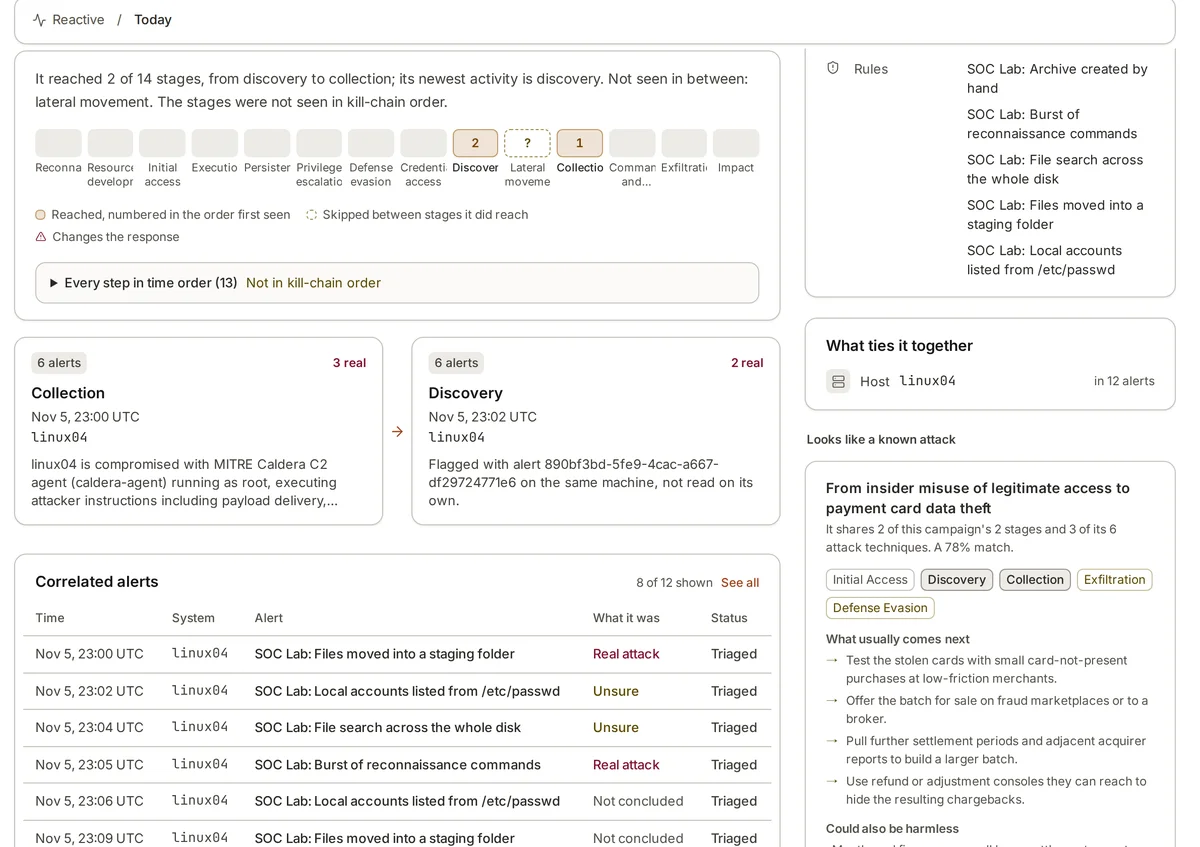
In our lab we run MITRE Caldera, an open-source adversary simulation tool, against a few Linux machines watched by Elastic Security. On a machine called linux04, a Caldera agent ran a burst of reconnaissance commands and Elastic raised an alert called “Burst of reconnaissance commands”.
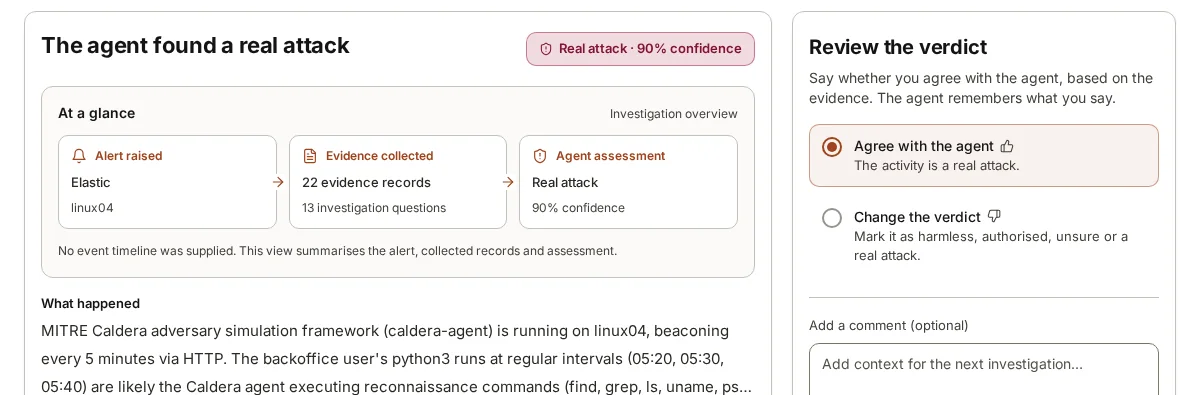
The alert itself was about the commands, not the network. While investigating it, armor360 looked at what else the process was doing and found a process named caldera-agent calling out over HTTP every five minutes: a beacon. That finding mattered, because it showed the reconnaissance was not a one-off administrator session but software under remote control. The investigation asked 13 questions, kept 22 records from 4 data sources, and reached a verdict of Real attack at 90% confidence in 5 minutes 35 seconds.
The lesson is general. Beaconing is often found while investigating something else. When an alert points at a suspicious process, always ask what that process connects to, and how often.
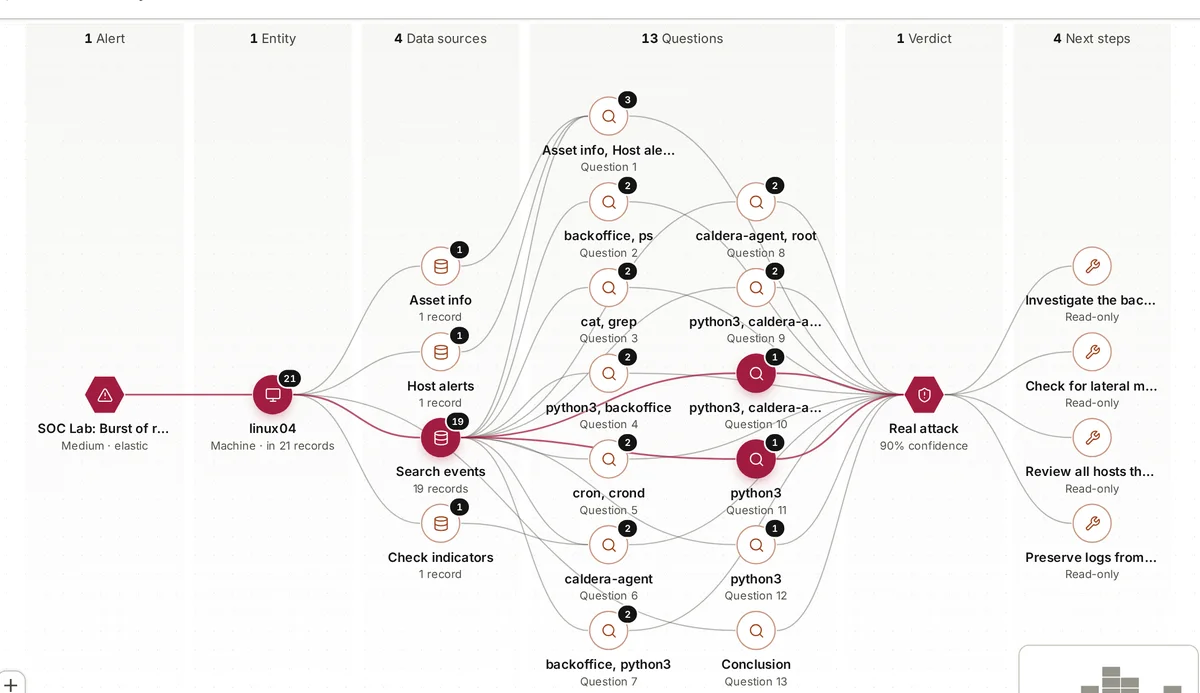
Where armor360 fits
armor360 investigates alerts from the security tools you already run, querying process chains, network activity, other alerts on the host and threat-intel lookups of indicators. Every record it collects is kept and cited where it is used, and a person reviews the verdict and decides what to do.
armor360 takes no response actions. It recommends next steps; your people decide and act.