Silence is a blind spot, not good news
A machine that stops sending logs does not raise alerts, and that is the problem. Every detection rule you run assumes the data is arriving. When a server goes quiet, its rules keep running and keep finding nothing, and an empty queue looks the same as a safe one. Finding silent machines is a routine check, and it belongs in the weekly work of any security team.
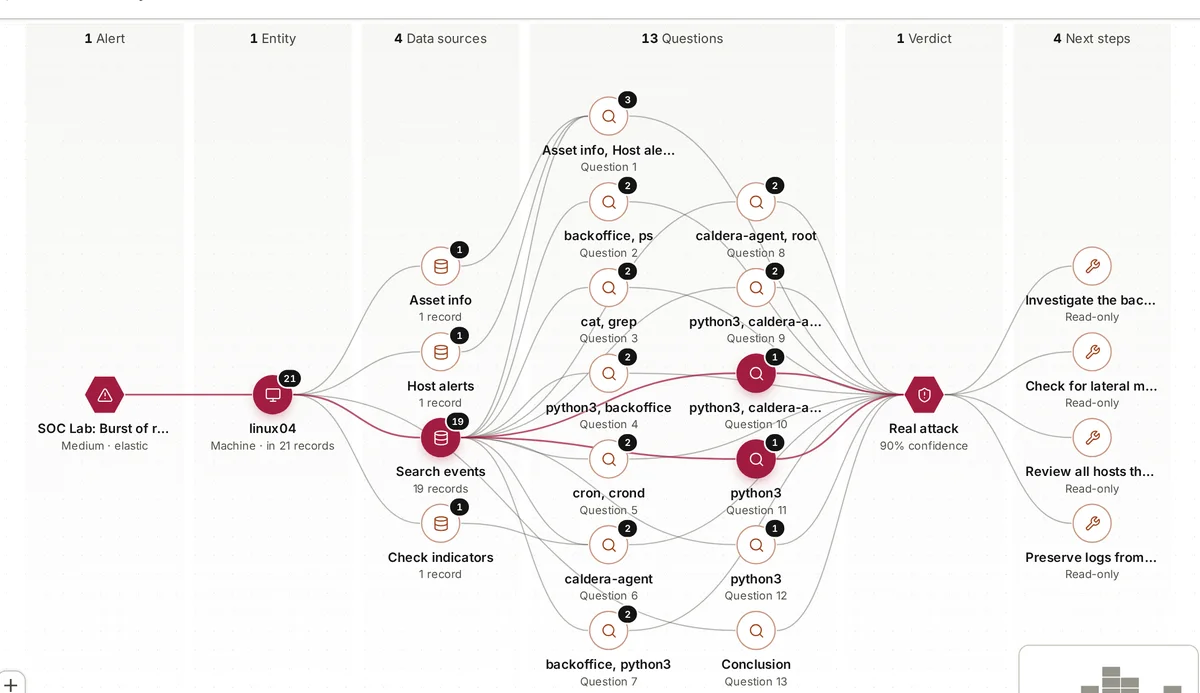
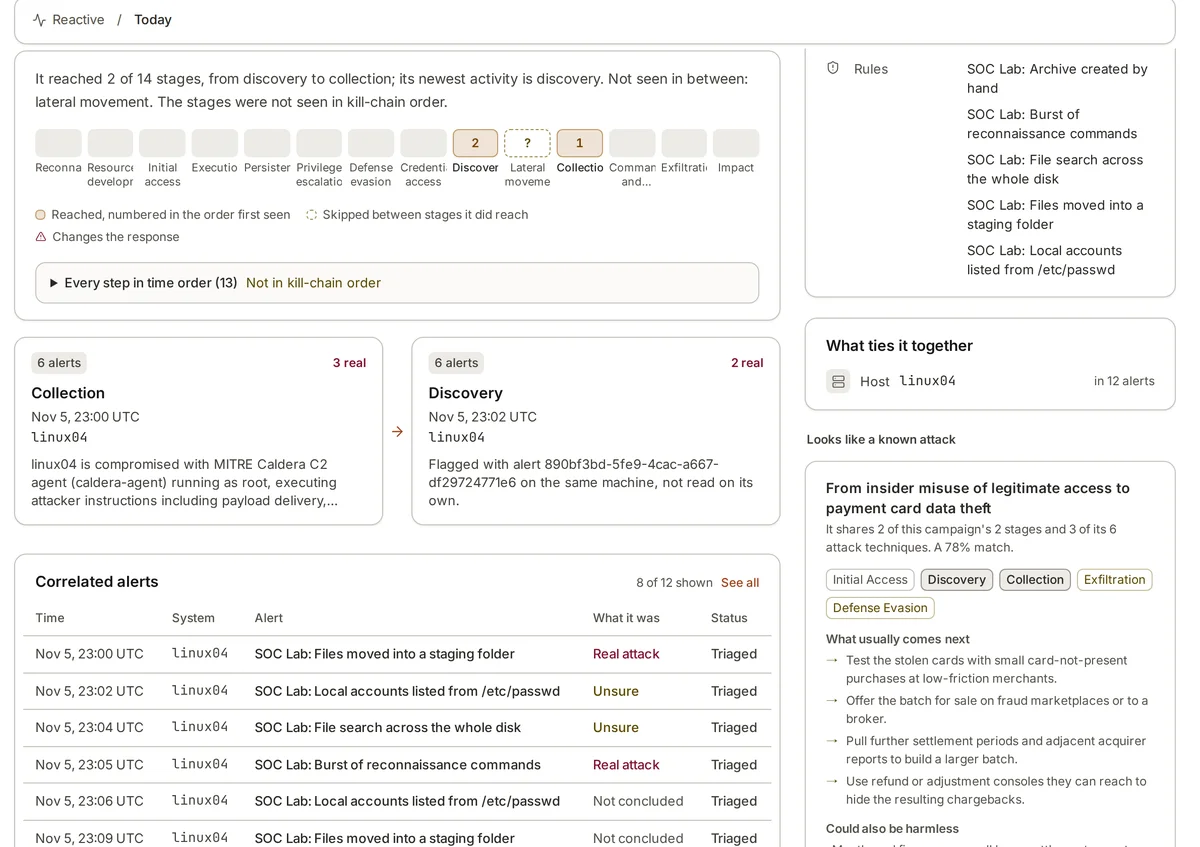
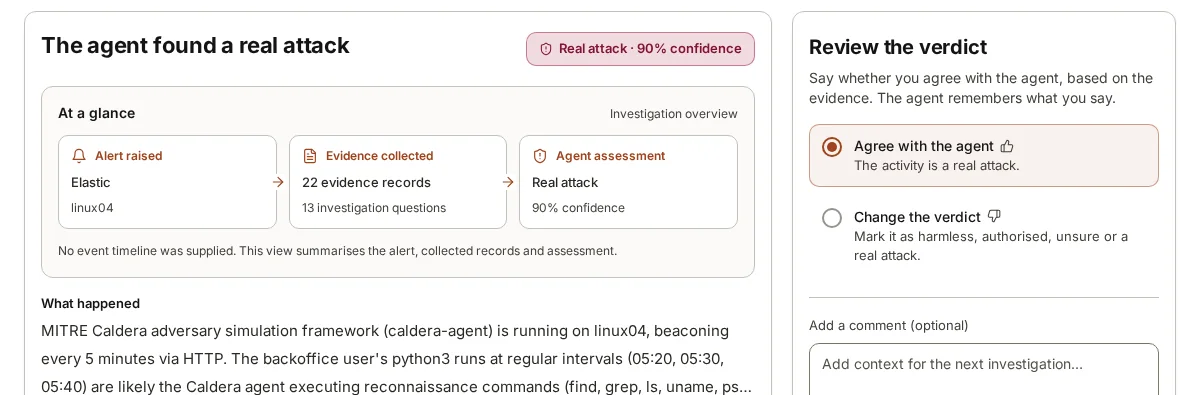
A silent machine also damages investigations after the fact. If an alert on one server leads you to a second machine and that machine stopped sending process events a month ago, you cannot tell what happened there. The questions an analyst needs to answer, what ran, who logged on, where it connected, all go unanswered, and the honest verdict becomes “unsure” rather than harmless or real.
Silence is also something attackers create on purpose. Stopping the logging agent, disabling the audit system or clearing logs are all known techniques in MITRE ATT&CK, under Impair Defenses (T1562) and Indicator Removal (T1070). Most silent machines have a dull explanation, but you cannot know which kind you have until you look.
The usual reasons a machine goes quiet
In practice the causes fall into a small number of groups, and each leaves its own traces.
- The agent stopped: the collection agent crashed, failed an upgrade, lost its enrolment, or was stopped by someone. In Elastic Fleet the agent shows as offline or unhealthy, with a last check-in time.
- A network change: a new firewall rule, a moved subnet, a changed proxy or an expired certificate means the agent runs but cannot deliver. The agent’s own logs usually show connection or TLS errors.
- A full disk: when the disk fills, agents cannot write their queue, and local logging may stop too. Other monitoring often shows the disk alert first.
- Retired or rebuilt hosts: a decommissioned machine should go quiet; a rebuilt one may come back under a new name or ID without the agent, leaving the old record silent and the new machine unwatched.
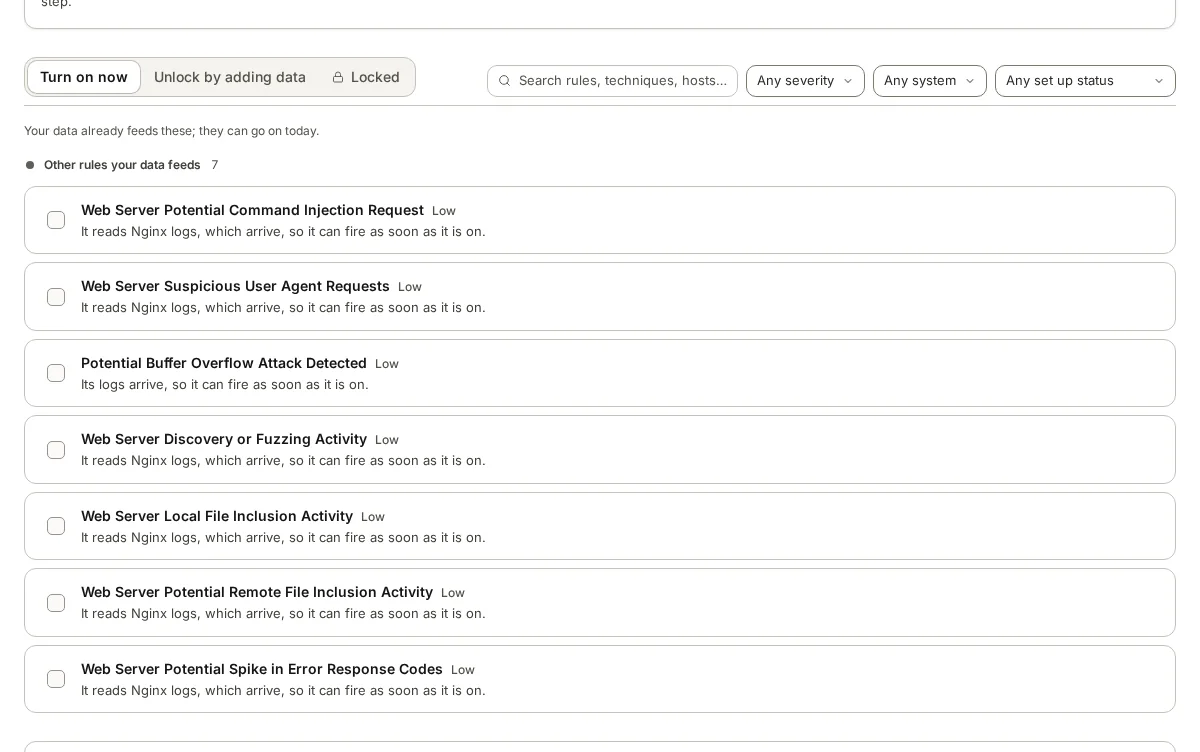
- Policy changes: an edited agent policy or integration can drop a log type, for example removing process events, so the host still reports but no longer sends what your rules need.
- Clock problems: a machine with a wrong clock sends events with timestamps far in the past or future, so searches for “the last hour” miss them.
How to find silent machines
The core check is simple: for each host, when did you last receive an event, and is that later than you would expect? In Elastic, an ES|QL query such as FROM logs-* | STATS last_seen = MAX(@timestamp) BY host.name gives you the last event per machine; sort by last_seen and the quiet ones rise to the top. In Splunk, | tstats latest(_time) AS last_seen WHERE index=* BY host does the same job. In Microsoft Sentinel, the Heartbeat table shows when each machine’s agent last reported.
Check per log type, not just per host. A Linux server that still sends system logs but stopped sending process events looks healthy in a per-host check and is blind to most of your Linux rules. Group by host.name and data_stream.dataset (or index and sourcetype) to see which feeds each machine still delivers.
Finally, compare what is reporting with what should be. Your asset inventory, configuration management database or cloud account lists tell you which machines exist. Any machine in the inventory that has never sent a log is a bigger gap than one that stopped yesterday, because nobody has ever been watching it.
- Last event per host, sorted oldest first
- Last event per host and log type, to catch feeds that dropped
- Agent status and last check-in from your fleet management
- Inventory compared with reporting hosts, to find machines never covered
- Gaps between event time and ingest time (@timestamp versus event.ingested), to catch clock problems
Setting what “too quiet” means
A single threshold for every machine produces noise. A busy web server that goes quiet for ten minutes is strange; a laptop that is off over a weekend is not. Set expectations by type of machine: servers that should report constantly, workstations that follow working hours, and occasional systems such as a monthly batch server.
Expected silence should be written down too. If a machine is retired, remove it from the list of hosts you expect to hear from, and record when and why. If a laptop is in a drawer for a month, that is fine, but someone should know. Without these records, the list of silent machines fills with known cases and the real ones get lost among them.
Weight the result by what each machine does. A silent domain controller, payment server or customer database is urgent. A silent test machine can wait until the weekly review. This is where knowing which business process each machine serves pays off: the question is not only “which machines are quiet” but “which of the quiet ones matter”.
A simple routine for checking coverage
Turn the checks into a habit rather than a project. Daily, look at critical machines that have not reported within their expected window, and treat a sudden stop on one of them as something to investigate, not only fix: check who was logged on and what ran just before the logs stopped. Weekly, review all machines that went quiet, the log types that dropped, and new machines in the inventory with no logs at all. After every change to agent policies, firewalls or proxies, rerun the per-log-type check.
When a machine comes back, check what you missed. Look at the gap: when did the logs stop, when did they resume, and did anything happen on the machine in between that you can still see from other sources, such as firewall logs, identity logs or the logs of the machines it talks to? If the agent buffered events locally, confirm they arrived after the fix rather than being lost. And if the stop had no clear cause, treat it as a security question, not only an operations one: who had access to the machine, and could they have stopped the agent?
For each silent machine, record the cause and the fix. Over a few weeks the records show patterns: a policy that keeps dropping a feed, a team that rebuilds machines without the agent, a subnet that needs a firewall rule. Fixing those patterns is worth more than chasing machines one at a time.
Report coverage alongside your other security measures. A short line in the weekly summary, how many machines are watched, how many went quiet, which log types are missing and what was fixed, keeps the subject visible to the people who own the machines and makes gaps everyone’s problem rather than only the security team’s.
Where armor360 fits
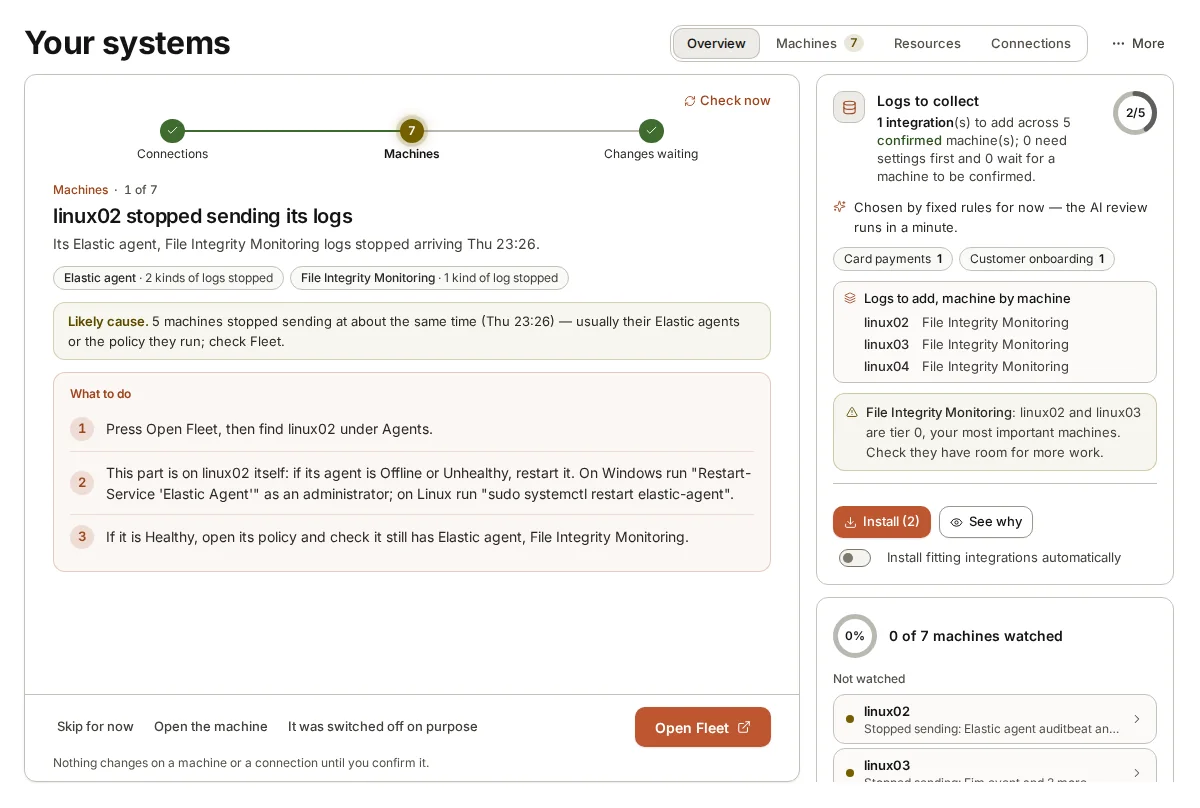
armor360’s coverage view finds machines that stopped sending logs, with the likely cause and the fix, for example checking the Elastic Agent on that host. It shows how many machines are watched and which log types are missing, and suggests the Elastic integrations each machine needs, adding them through Elastic Fleet once a person confirms.